The tool enables a detailed analysis of the Human Footprint and supports conservation studies of threatened primates
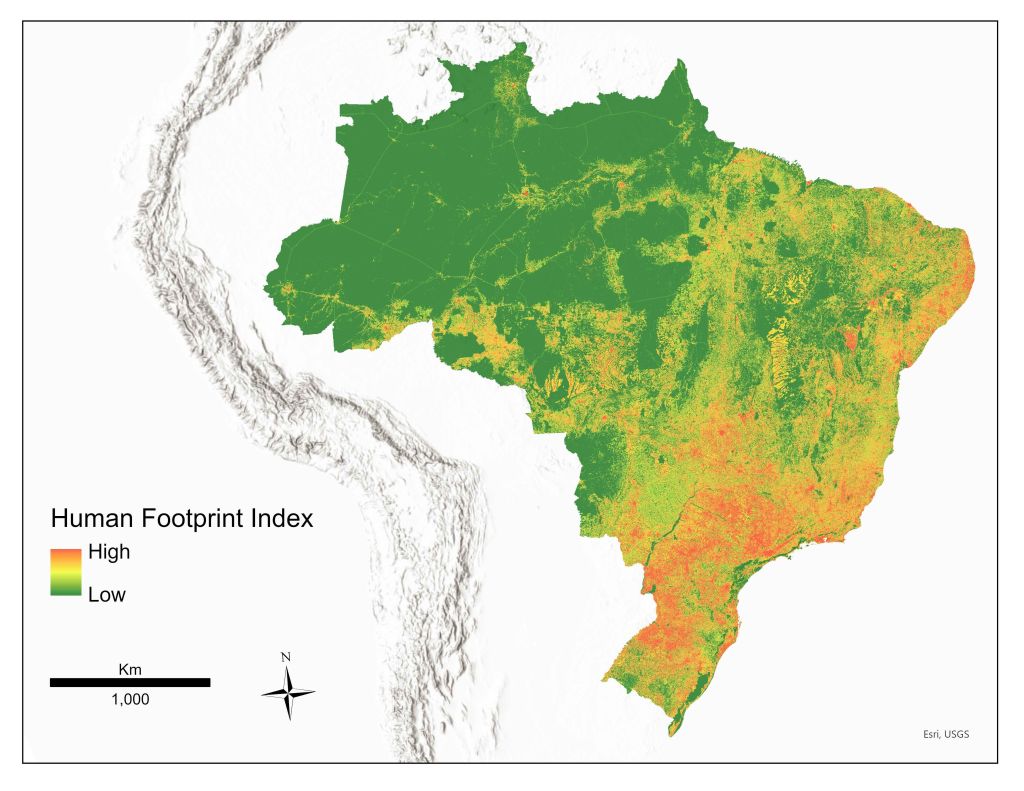
What happens to the behavior of capuchin monkeys when the environment around them turns into pasture, a city, or is crossed by a power transmission line? To answer this question, a group of researchers needed an objective measure of habitat transformation. What was initially intended to be an index restricted to nine study areas ended up expanding into a detailed map of human impact on the environment—the Human Footprint—for all of Brazil, with a 10-meter resolution. The results were published in late 2025 in the journal Scientific Data; the data are available in the Zenodo repository, along with a visualization interface on Google Earth Engine.
The initiative arose from the need to understand how the modification of natural habitats affects the behavioral plasticity of capuchin monkey populations. “We investigated nine populations of capuchin monkeys to understand their ability to adapt to environments that are changing rapidly,” explains Patrícia Izar (Institute of Psychology, University of São Paulo), one of the study’s authors. “We needed an objective measure of these habitat transformations, which is why we started this mapping effort.” The research is part of the project “Phenotypic plasticity of capuchin monkeys (genus Sapajus) phase 2: an investigation into the effects of human-driven environmental change,” coordinated by Patrícia Izar and linked to the Biota/FAPESP program.
“The Human Footprint Index was first published in 2002 and has been used by numerous research groups as a measure of human impact on the environment,” explains Patrícia Izar. The initial idea was to calculate the index only for the nine areas where the research is conducted, but the proposal took on a new dimension during the team’s discussions. “The needs of the researchers in each area were different, and as we looked at those needs and the data we had at hand, we ended up choosing to map the entire country,” says Andrea Presotto, a researcher at East Carolina University (USA) and the first author of the paper.
“Most global human footprint indices have a resolution of one square kilometer, but that was not sufficient to meet the demands of our project,” the researcher explains. A bearded capuchin monkey (Sapajus libidinosus) observed in the mangroves of Maranhão, for example, has a home range of only 37 hectares—less than 40% of a single pixel in traditional global Human Footprint indices. The common marmoset (Callithrix jacchus), in turn, can have a home range of just 7.31 hectares, equivalent to 7% of a conventional pixel. When evaluating the land cover maps available on MapBiomas for Brazil, the researcher identified the possibility of creating the index at a 10-meter resolution, which would provide the level of detail needed to assess the impact of habitat transformations on capuchin monkeys.
Eight variables, more than 86 billion pixels
To make the project feasible, the researchers had to overcome some technological challenges. “The computers we had were not enough, so we established a partnership to access a machine with 54 processors,” recalls Andrea Presotto. Data processing took six months and required the development of custom Python code to optimize the calculations.
The methodology adapted global human footprint indices, incorporating eight main variables: land cover (deforestation, agriculture, and urban areas), building density, highways, railways, power transmission lines, and navigable waterways. Conventional indices use, for example, population data and nighttime visible light images. In the team’s adaptation, additional, more detailed information was incorporated. “Instead of using only population data, we used population plus building density data available for Brazil. We also added IBGE data on electricity transmission lines, which are newer and provide more detail than nighttime visible light images,” the researcher explains.
Each of the resulting 86.5 billion pixels received a score ranging from 0 to 100, where 0 represents the lowest human impact and 100 the highest. To derive this value, the researchers summed weighted contributions from each variable, considering their relevance to the conservation of primates and other medium-sized and large mammals. Land cover and building density each received a weight of 40%; highways, 10%; railways and waterways, 5% each.
“What determines the pixel’s class is land cover. On top of land cover come all the other variables,” explains Andrea Presotto. For example, a pixel classified as forest receives a value of zero in the land cover layer. If it is affected by the influence of a transmission line, that value is increased according to the distance from the infrastructure. The final result is a measure that reflects the combined effects of human pressures on each point of the national territory.
The data were also validated using high-resolution images obtained by drones and satellites in three areas representative of the project: Carlos Botelho State Park (SP), in the Atlantic Forest; the Gilbués region (PI), in the Cerrado; and the Atins community (MA), in the mangroves of Maranhão. Overall agreement for land cover classification reached 95.6%, while the location of highways showed 100% accuracy. Accuracy for buildings was 86.7%.
What the map already reveals and the next steps
The detailed mapping materializes concerns already known to the scientific community and reveals new questions. Although the Amazon contains the largest continuous stretches of preserved areas, the biome exhibits a “fishbone” pattern of occupation, where deforestation follows roads and transmission lines, fragmenting the landscape. The Cerrado and Caatinga, in turn, rank among the most heavily impacted regions, mainly due to agricultural expansion. A surprise came from the Pantanal. “Apparently, the lowest human footprint index is in the Pantanal,” observes Andrea Presotto. “Perhaps because the flooded areas make it harder for certain types of human pressure to reach these areas, but we observed that the biome has, proportionally, a larger area that is less impacted.”
Carlos Botelho State Park, a protected area where Patrícia Izar has been conducting research since 2001, illustrates another phenomenon captured by the map. Although the vegetation inside the park remains preserved, the surrounding area has undergone profound changes over the past two decades, with the expansion of roads, agriculture, and infrastructure. “We were impressed,” admits Patrícia Izar. “If we look only at vegetation cover maps, it seems like everything is fine. But when you look at the surroundings, it has undergone major changes in these last twenty years.” The map also highlights worrying situations in formally protected areas. The Caru Reserve in Maranhão, which is home to about seven primate species, is bisected by a railway. “It has an influence inside the forest because deforestation is occurring along the train’s passage; there is noise, and many other things we haven’t measured,” laments Andrea Presotto.
The next step of the research, already underway, is to explore correlations between the Human Footprint Index and the behavior of capuchin monkeys in the nine original areas of the project. “Our idea is this: the capuchin monkey is academically famous for its ability to adapt to environments with very different ecological characteristics. But if we start changing those characteristics artificially, how does the capuchin monkey adjust to all of this? Does it truly adapt? Or to what extent is it resisting?” explains Patrícia Izar.
The entire dataset, including maps, code, and metadata, is freely available in online repositories, along with an interface on Google Earth Engine that allows interactive exploration of the national territory. The source code has also been made available so the method can be replicated in other countries.
Beyond its immediate application in primate studies, this mapping opens up possibilities in multiple fields, and the researchers encourage other groups to use and adapt the methodology, adjusting the variable weights according to their specific research questions. “It can be used in any area to examine the extent and distribution of these impacts—not only impacts on wildlife, but perhaps even to assess some impact on humans, the amount of agriculture, the amount of urbanization in certain areas, or to associate with carbon emissions,” says Andrea Presotto.
“This is a distinctively Brazilian academic effort, using data from MapBiomas, data from IBGE, and significant public investment in data generation. It is a tool with incredible potential to answer not only the questions we are already asking, but also many new questions. And, especially, it is a tool that is completely available,” concludes Patrícia Izar.
Access the full article:
Presotto, A., Hamilton, S. & Izar, P. A 10‑meter resolution human footprint dataset to support biodiversity and conservation studies in Brazil. Sci Data 12, 1754 (2025). https://doi.org/10.1038/s41597-025-06034-0